Quantum Chemical Models of Electronic Transitions of Conjugated Dyes
By: Brittany Schaum
Abstract
UV-Vis spectroscopy was used to determine the energy of transition, △E , from the highest occupied molecular orbital (HOMO) to the lowest unoccupied molecular orbital (LUMO) of several cationic dyes. Each dye contains a conjugated, hydrocarbon π system with nitrogens at each end, which act as potential barriers for the π electrons in these systems. In this experiment, we have treated each dye as a one-dimensional “particle in a box” in order to simplify the calculation of . We also derive eq. 12 and 13 from this model in order to predict , which we compared with experimental data. Our initial approximation of (eq. 12) was poor, with ~20% error on average, but when a variable parameter, α, was added, calculations were quite accurate, with < 5% error. The calculated value for α was 0.682543. Gaussian was also used to predict also with large error, ~20%. However, experimental data for was quite accurate, with < 1% error compared to literature values.
- Introduction
Our understanding of the behaviour of electrons owes itself to quantum mechanics. Quantum mechanics reveals that particles exhibit wave-like properties on the atomic scale, and thus, exist in discrete states with characteristic energy levels. Since the amount of energy an electron can have in non-continuous, it follows that an electron can only gain or lose an amount of energy exactly equal to the difference in energy between its current state and another discrete state. It is known that electrons gain or lose energy in the form of electromagnetic radiation, which of course always has a characteristic wavelength. The electronic transitions which occur between atomic and also complex molecular orbitals can be observed by exploiting this fact. The lowest energy transition of electrons in a molecule is typically the transition between the HOMO (highest occupied molecular orbital) and the LUMO (lowest unoccupied molecular orbital). The relationship between the difference in energy between two electronic states and the corresponding wavelength of electromagnetic radiation is4

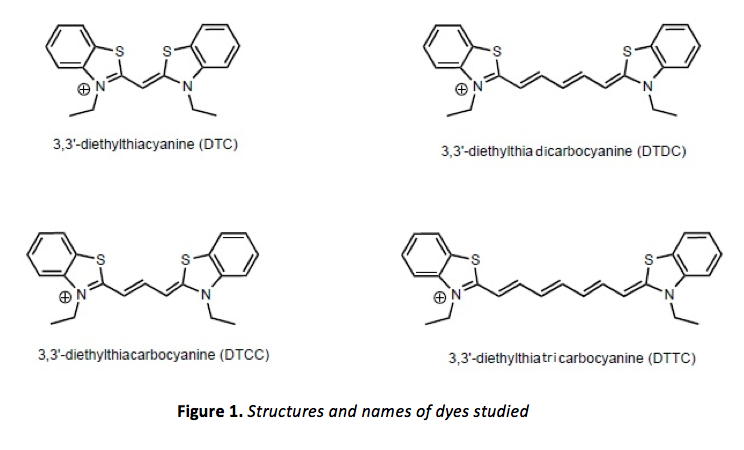
where△E, h, c, and l represent the change in energy, Planck’s constant, and the speed and wavelength of the electromagnetic radiation, respectively. It is clear from eq. 1 that lower energy transitions in a molecule correspond to longer wavelengths. When these energetic differences are less than about 70 kcal/mol, visible light (electromagnetic radiation in the range of ~ 380-760 nm) is emitted/absorbed. Molecules with conspicuous color tend to be ones with highly conjugated p-systems. Four examples of such molecules, cationic dyes with extended p-systems, were studied in this experiment.
The states of electrons and their corresponding energies can also be described by the non-relativistic (time-independent) Schrödinger equation4

where m is the mass of the electron, is the Laplacian operator, V(r) is the position-dependent potential operator, E is the energy of the electron, and is the wave function (where r represents the position coordinates). When no potential is acting upon the electron (or if it is negligible), eq. 2 reduces to

Such is the case for a “particle in a box,” or a particle which is confined to an area of zero (or constant) potential by infinite potential “walls.” In fact, the wave function for a one-dimensional particle in a box is

where L is the “length” of the box, or the length of the space to which the particle is confined. In highly conjugated p-systems, such as those in the molecules shown in figure 1, molecules can be thought of as essentially planar, with all p orbitals parallel to one another and with p electrons moving freely within this p system, according to Erich Hückel. This “free-electron” model3, although an approximation, is quite simple as well as accurate when compared to experimental results. Analysis of the molecular orbitals of the molecules shown in figure 1 would be otherwise quite complex, and indeed, computer software can also be used for this analysis.
If the “free electron” model is to be used to analyze the dyes shown in figure 1, the benzene rings are ignored and the p system is thought to consist of one p-orbital for each of the two nitrogen atoms, plus one for each carbon atom in the chain connecting them. It is also assumed that potential energy remains constant everywhere along this chain, and that the potential essentially reaches infinity just beyond the nitrogen atoms. The “particles” in this particle in a box model are, of course, the p electrons of this conjugated system, and solving eq. 3 (an eigenvalue equation) by substituting eq. 4 (an appropriate eigenfunction for eq. 3) we can obtain their energy levels (the eigenvalues of this eigenfunction):

where n is any integer > 0. According to the Pauli exclusion principal, the number of electrons which occupy any given energy level cannot exceed two, which therefore means that the ground state of any molecule with N p electrons will have filled energy levels if N is even, and filled levels if N is odd. The n-value which corresponds to the HOMO would be
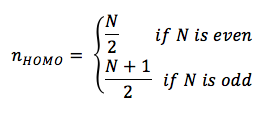
and the n-value which corresponds to the LUMO would be
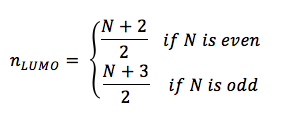
△E for the lowest energy electronic transition is that of a transition between the HOMO and LUMO, and is equal to

For the cationic dyes studied in this experiment, there are three p electrons from the two nitrogen atoms, and one p electron for every carbon atom in the chain connecting them. If we let p = the number of carbon atoms in the p system of each dye, it follows that N = p + 3. Since the number of carbon atoms in the chain of each dye is odd, N will always be odd, since N = p + 3 and p is always an odd number. Thus, eq. 8 reduces to

In this experiment, the lowest-energy electronic transition of each dye pictured in figure 1 was analyzed using UV-Vis spectroscopy. Since this transition in these dyes occurs upon absorption of electromagnetic radiation in the visible light region, the most prominent absorbance band for each molecule should be between 380 and 760 nm. If we substitute eq. 1 into eq. 9 and solve for we have

where is the wavelength of maximum absorbance, since a Boltzmann5 distribution predicts that the wavelength of maximum absorbance will be that of the lowest energy electronic transition (that which occurs between the HOMO and LUMO). L for each dye is estimated to be the sum of the length of the carbon chain between the nitrogen atoms and one bond length on each side. Since the number of bonds between each nitrogen atom is p + 1, if each bond length is estimated to be approximately the same (due to conjugation), say, a length l, then L = (p + 3)l. If we substitute this into eq. 10 and use the fact that N = p + 3, we have

If we predict that l is approximately equal to the bond length observed in benzene (1.39 Å), and substitute the mass of an electron, the speed of light, and Planck’s constant, we can say that

approximately, where is in nanometers. Since it is more likely that the potential at each end of the chain rises gradually rather than jumping to infinity, we can add a variable parameter, α, to L to account for this additional length (this will also help make the approximation of the bond lengths in the chain more appropriate, since they may not be exactly 1.39 Å) by saying instead that L = (p + 3 + α)l. Thus, eq. 12 becomes

where α should remain constant for this series of molecules (the only difference between each molecule is the length of the internitrogenous carbon chain). In this experiment, calculations of using eq. 13 were compared to experimental observations of for each dye in order to optimize α.
Additionally, the computer program, Gaussian, was used to predict the lowest-energy conformation of each structure shown in figure 1, and then to calculate the energy of the HOMO and LUMO of each dye (which can be used to estimate ). These results were also compared to experimental data.
- Experimental method
Part 1. An Ocean Optics Spectrometer was used to obtain UV-Vis spectra of each cationic dye shown in figure 1. Methanolic solutions of each dye were created, and concentrations were adjusted until absorbance bands had maximum intensities just below 1 (all concentrations were on the order of micromolar). The absorbance data for each dye was recorded and plotted in Microsoft Excel. This data was used to determine for each dye.
Part 2. Eq. 13 was used, with a starting value of 1 for α, in order to obtain theoretical values for for each dye. In Microsoft Excel, the Solver add-in was used to optimize α; α was allowed to vary until the minimum value for the sum of the difference of squares of each theoretical and experimental was obtained.
Part 3. The computer program, Gaussian, was used to calculate for each dye shown in figure 1. First, semi-empirical AM1 geometry optimizations for each dye were performed (hydrogen atoms were substituted for the ethyl groups attached to nitrogen in each dye when constructing each molecule). Next, more rigorous geometrical optimization was performed at the HF/3-21G level. The output of these geometric optimizations were used in order to perform single-point calculations at the DFT/3-21G and DFT/6-31+ level. The MO editor in Gaussian was used in order to obtain the energy of the HOMOs and LUMOs of each dye for each calculation method.
Once Gaussian was used to determine the energy of the HOMO and LUMO of each dye, was calculated in order to obtain a theoretical value for , using eq. 1 (where eq. 1 was rearranged to solve for ). This was done for the results of both the DFT/3-21G and DFT/6-31G+ methods of single point calculation.
- Results
First, an Ocean Optics Spectrometer was used to obtain UV-Vis spectra of each cationic dye shown in figure 1. Methanolic solutions of each dye were created, and concentrations were adjusted until absorbance bands had maximum intensities just below 1. These spectra can be viewed in figure 2.
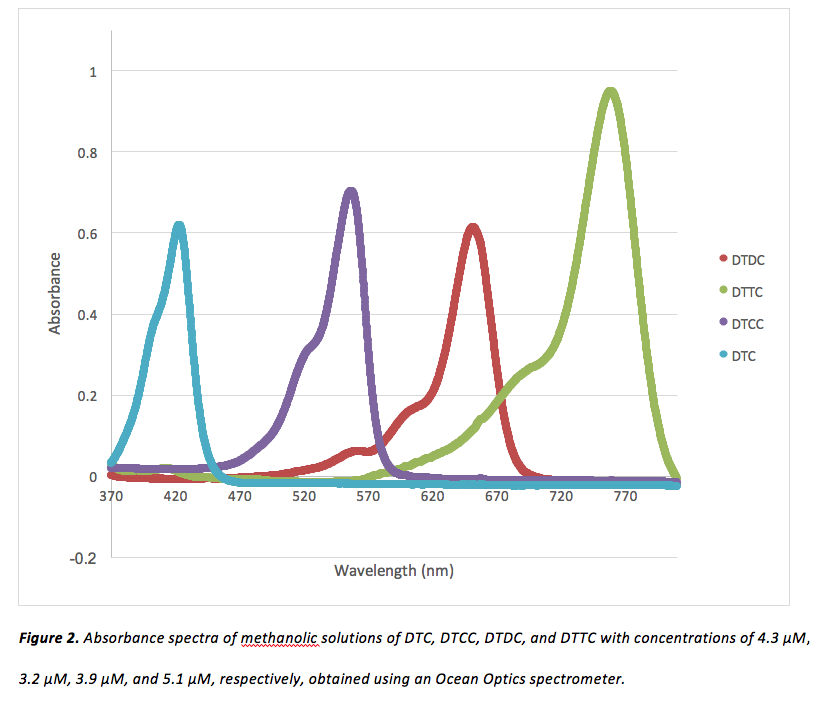
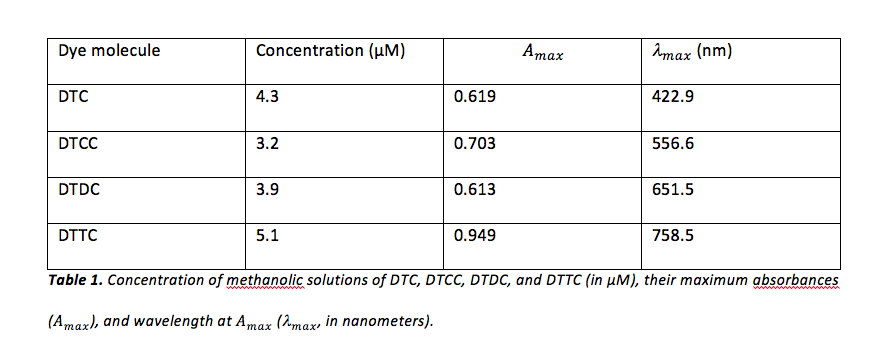
To determine for each dye, absorption data was copied into Microsoft Excel. Absorbance values for each dye were sorted greatest-to-least by Excel, and the corresponding wavelengths were recorded. The values obtained for for each dye can be viewed in table 1.
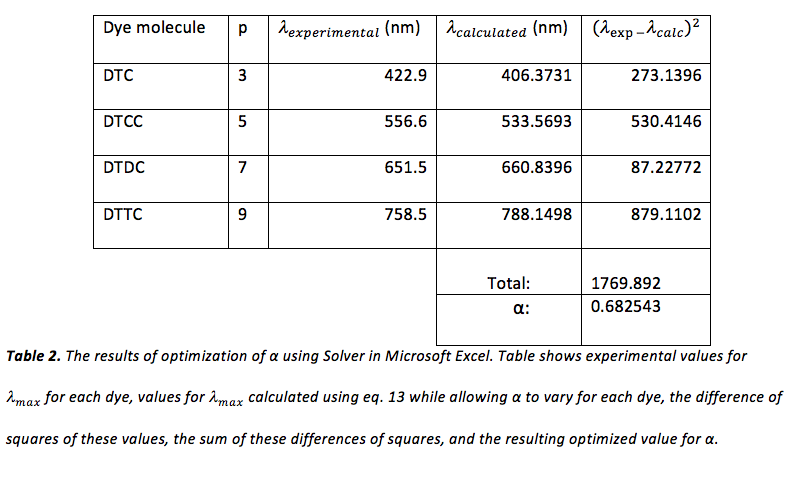
Next, eq. 13 was used, with a starting value of 1 for α, in order to obtain theoretical values for for each dye. Values of p used for DTC, DTCC, DTDC, and DTTC were 3, 5, 7, and 9, respectively. In Microsoft Excel, the Solver add-in was used to optimize α. This was done by allowing α to vary until the minimum value for the sum of the difference of squares of each theoretical and experimental was obtained. The results of this optimization can be viewed in table 2.
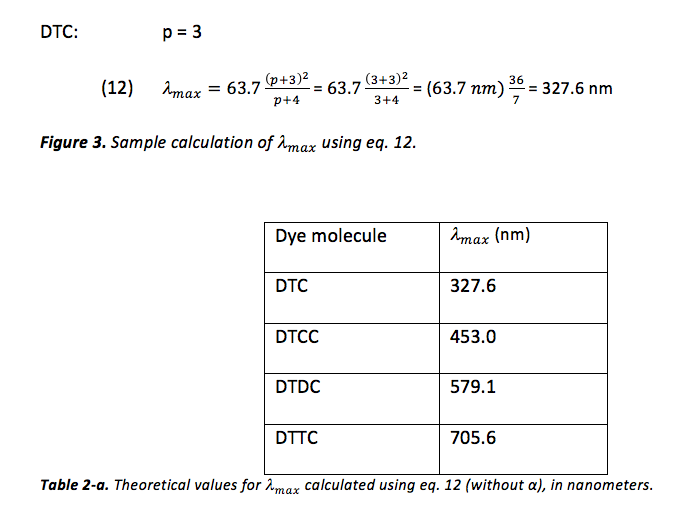
Predictions for the value of were also calculated without the variable parameter α, shown in table 2-a, and an example of this calculation can be viewed in figure 3.
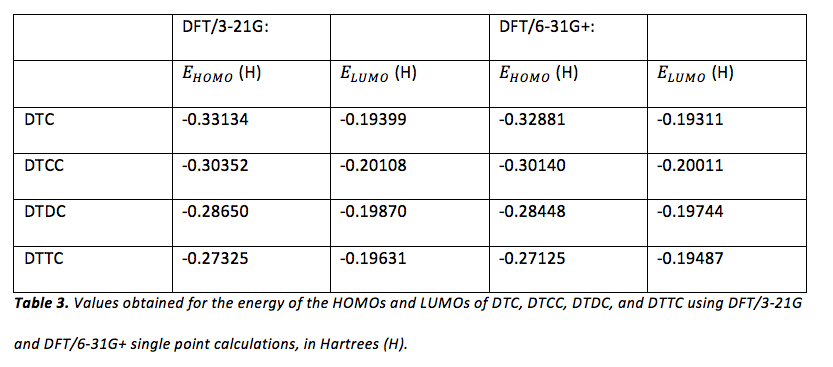
The computer program, Gaussian, was also used to calculate for each dye shown in figure 1. First, semi-empirical AM1 geometry optimizations for each dye were performed (hydrogen atoms were substituted for the ethyl groups attached to nitrogen in each dye when constructing each molecule). Next, more rigorous geometrical optimization was performed at the HF/3-21G level. The output of these geometric optimizations were used in order to perform single-point calculations at the DFT/3-21G and DFT/6-31+ level. The MO editor in Gaussian was used in order to obtain the energy of the HOMOs and LUMOs of each dye for each calculation method. The results of these calculations can be viewed in table 3.
The MO editor in Gaussian was also used to visualize the HOMOs and LUMOs of each dye. Samples of these visualizations are shown in figures 4 – 7.
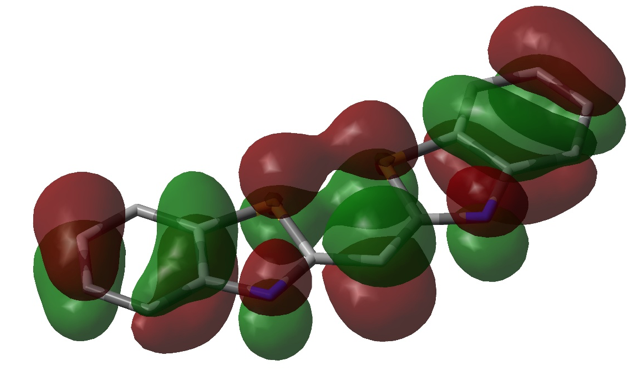
Figure 4. Visualization of the HOMO of DTC using DFT/6-31G+ single point calculation in Gaussian. Initial geometric optimization using AM1 can also be seen (the structure was estimated to be completely planar). Opposite phases are represented by green and red, sulfur is represented by yellow tube, and nitrogen is represented by a blue tube. The remaining tube structure (in grey) represents the remaining carbon “frame” of the molecule.
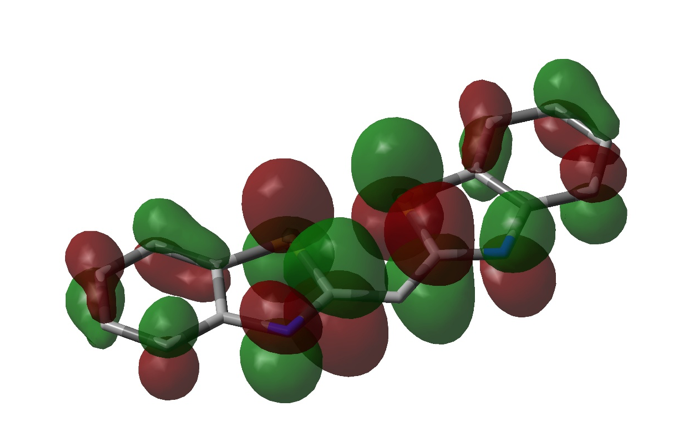
Figure 5. Visualization of the LUMO of DTC, also using DFT/6-31G+ single point calculation in Gaussian (representation is similar to that of figure 4).
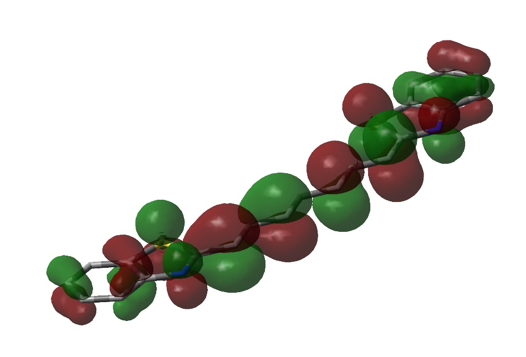
Figure 6. Visualization of the HOMO of DTTC, using DFT/3-21G single point calculation in Gaussian (representation is similar to that of figures 4 and 5).
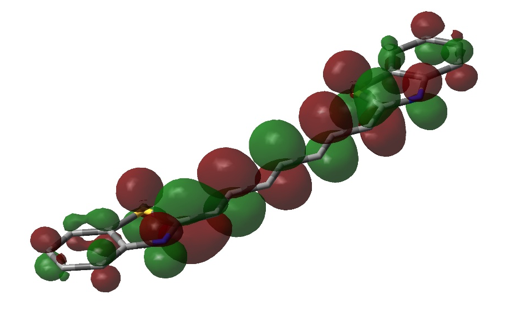
Figure 7. Visualization of the LUMO of DTTC, using DFT/3-21G single point calculation in Gaussian (representation is similar to that of figures 4, 5, and 6).
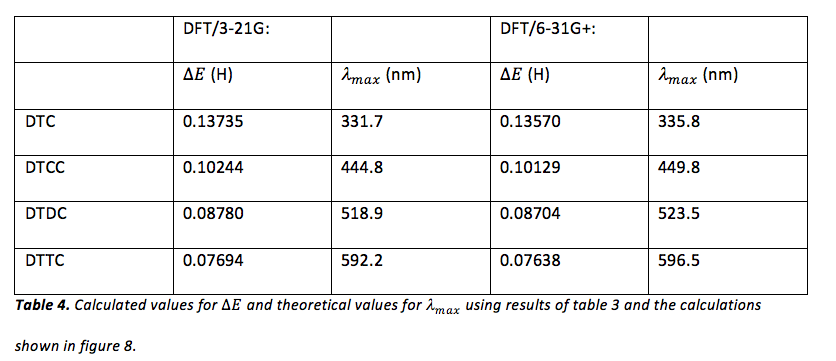
Once Gaussian was used to determine the energy of the HOMO and LUMO of each dye (table 3), the difference in energy between the HOMO and LUMO of each dye was calculated in order to obtain a theoretical value for , using eq. 1 (where eq. 1 was rearranged to solve for ). This was done for the results of both the DFT/3-21G and DFT/6-31G+ methods of single point calculation. Since Gaussian yields energy values in units of Hartrees, these values were converted to Joules before using eq. 1. An example of this calculation can be viewed in figure 8 and the results of these calculations can be viewed in table 4.

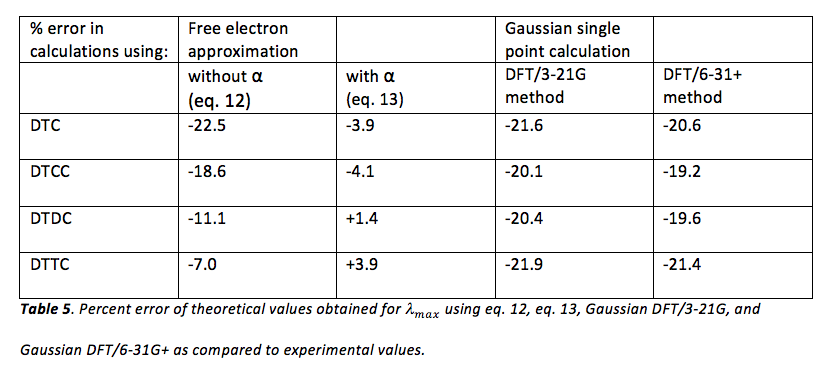
Finally, values obtained for using eq. 12, eq. 13, and Gaussian were compared to experimental values (table 1). Percent errors in theoretical values were obtained using the sample calculation shown in figure 9 and the results of these calculations can be viewed in table 5.

Figure 9. Sample calculation of percent error for the theoretical calculation of for DTC using Gaussian DFT/6-31G+ single point calculation.
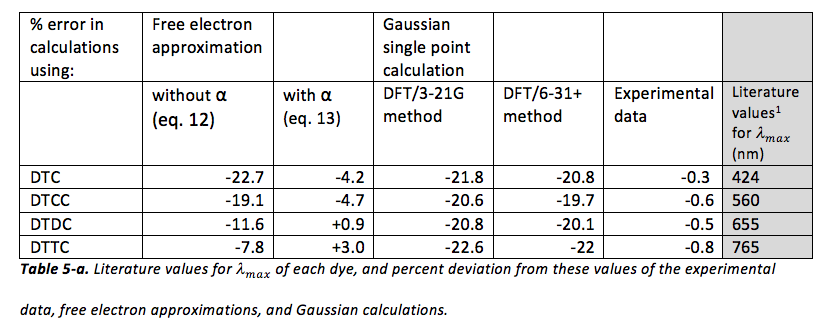
Literature values for were also used to calculate percent error in experimental and theoretical data obtained. These results, as well as the literature values1 for of each dye, are shown in table 5-a.
Discussion
It would seem from the given literature values for DTC, DTCC, DTDC, and DTTC that the experimental data is quite accurate (the absolute value of the percent deviation of each is less than 1%). It would also seem that approximations using eq. 13 are also quite accurate (the absolute value of the percent deviation of each is less than 5%). However, all other approximations, especially those using Gaussian, seem to be quite inaccurate (the absolute value of the percent deviation of each is greater than 5%, and in fact, often exceeds 20%, which is quite high). In general, almost all approximations are underestimations of , with only two exceptions (both of which are approximations using eq. 13).
Considering the fact that the entire electromagnetic spectrum spans twenty-four orders of magnitude, that the visible light spectrum is hardly one order of magnitude in size, and that the approximations using Gaussian and eq. 12 estimate to be somewhere in the range of visible light, these methods actually seem quite impressive. However, there are obvious flaws in these approximations. In the approximation of using eq. 12, it is assumed that the bond length between all atoms in the internitrogenous chain of each dye molecule is precisely that of carbon-carbon bonds in benzene (1.39 Å), and that there is precisely one bond length of this length on either side of each nitrogen before the potential of the molecule reaches infinity. In reality, despite the fact that this region of each molecule is conjugated, it is not known if these bond lengths are precisely 1.39 Å (but eq. 12 assumes that this is so). Also, it is much more likely that instead of there being an infinite potential “wall” on either side of each nitrogen, the potential most likely rises gradually, which would allow an electron to move a bit further than expected. This explains the positive value of α; L is probably a bit longer than (p + 3)l. Additionally, even if there were infinite potential “walls” beyond either side of each nitrogen, quantum tunneling predicts that there is a certain probability of finding an electron beyond those walls. Despite the huge error in the Gaussian approximations of E, figures 4 – 7 show that the lowest energy conformation of each of the dye molecules studied is planar, and that there is a “boundary” (a node) just beyond each nitrogen, in both the HOMO and LUMO of each molecule. We have ignored the ethyl groups attached to nitrogen in each molecule, replacing them with hydrogens. In theory, this should not affect the energy of the π system, but because of the planar nature of the π system and the fact that the carbon twice removed from nitrogen should be able to move freely, there is perhaps a chance that there is some π or σ interaction from this carbon, which would of course affect the energy of the π system and make it deviate from the conditions of the “free electron” model. Calculations would have to be repeated with Gaussian with these ethyl groups added in order to see whether or not they affect the energy of the HOMO and LUMO (a time-dependent DFT may be in order, since the carbons in question should be in a non-inertial frame relative to the rest of the molecule). Also, while eq. 13 may seem most accurate, it is still an artifice, since we are simply using a variable parameter to “make up” for the lack of accuracy in the assumptions which allowed us to derive it, rather than accounting for physical factors which would explain this lack of accuracy. One simple correction, to start with, would be to recognize that the potential within the π system should not simply be zero, but rather, a non-zero constant (or a potential that is essentially constant). This would affect the application of eq. 2 (the non-relativistic Schrödinger equation), and thus, would result in different eigenvalues (energies). This would not affect . But if instead, a non-zero potential (V(r)) were present in the π system, then eq. 5 would instead read

and eq. 9 would read

where the subscripts n1 and n2 represent a possible dependence of V(r) on n. Since using eq. 12 predicts a shorter wavelength (higher ) for the HOMO/LUMO transition in every dye molecule, if V(r) depended on n, there would be a greater disparity in the energy of the HOMO and LUMO. Explorations of a possible function for should be explored by examining the discrepancy between experimental data and calculations from eq. 12.
References:
1. http://www.sigmaaldrich.com/catalog/product/sial/390410?lang=en®ion=US
2. Adapted from Garland, C. W., Nibler, J. W, and Shoemaker, D. P. Experiments in Physical
Chemistry, 8th Ed., McGraw-Hill, 2009, pp. 393-398
- Kuhn, H. J. Chem. Phys. 1949, 17, 1198
- Atkins, P. W., de Paula, J. Physical Chemistry, 8th Ed., New York, Freeman, 2006, pp. 279
- Bennett, C.A., Principals of Physical Optics, 1st edition; Danvers, MA; 2008
Here is a PDF of this document since some of the characters may not have copied to the HTML of the webpage correctly:
Quantum Chemical Models of Electronic Transitions of Conjugated Dyes
