Mendelian Genetics with Drosophila
Written by Lauren
Objective:
To explore the basic principles of genetics such as Medelian genetics using the model organism, Drosophila melanogaster.
Introduction:
Gregor Mendel, an Austrian monk, observed heritable traits in the common pea plant and discovered several key basic principles in Genetics. The pea plant was perfect organism for Mendel to observe because it reproduces quickly, and in large numbers, and is fairly easy to manipulate. What he discovered was that there are 7 inheritable traits that only have 2 variations. Mendel cross pollinated pure bred plants and discovered that traits are passed on to offspring in the F2 generation at a 3:1 ratio. (Klug, 2013). From this he was able to conclude that the inheritance of each trait is determined by units (genes), that individuals inherit one unit from each parent for each trait, and that while traits may not show up in the individual they can still be passed to the next generation. (O’Neil, 1997). While Mendel was the first to somewhat correctly explain genetic inheritance in 1966, his work went unrecognized for nearly 40 years.
Drosophila melanogaster was first used in the early 1900’s by William Castle to study embryology. T.H Morgan saw what Castle was doing with the fruit flies and began to use them as well. While studying Drosophila, Morgan found his first white eye mutant which lead to the rediscovery of Mendelian genetics and expanded on Mendel’s work. By breeding this mutant with the normal red eye flies Morgan showed that the white eyes were a sex-linked mutation and went on to explain sex-linked inheritance and chromosome theory. (Morgan, 1910). Morgan had always rejected the idea that genes were located on chromosomes but with new technology not available to Mendel, he was able to pinpoint a gene’s location on a chromosome for the first time and he let his own data convince him otherwise. (Miko, 2008).
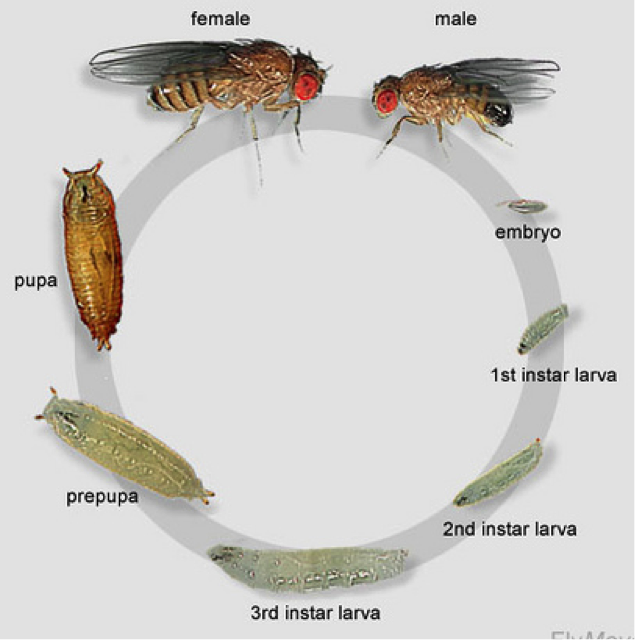
Drosophila is widely used for education because it is a fantastic model organism. Their short life cycle is one of the many reasons they are great to study. Drosophila can go from egg to adult in just 12 days with a few other stages in between. The eggs hatch within 24 and on day 1 we have first instar larvae, day 2 are second instar larvae and day 3 are third instar larvae. By day 7, there are large, visible larvae in the medium. These larvae will then pupae for about 4 days before emerging adults. Females are sexually mature after 8 hours and can then begin to mate and lay eggs. (Geiger, 2012)
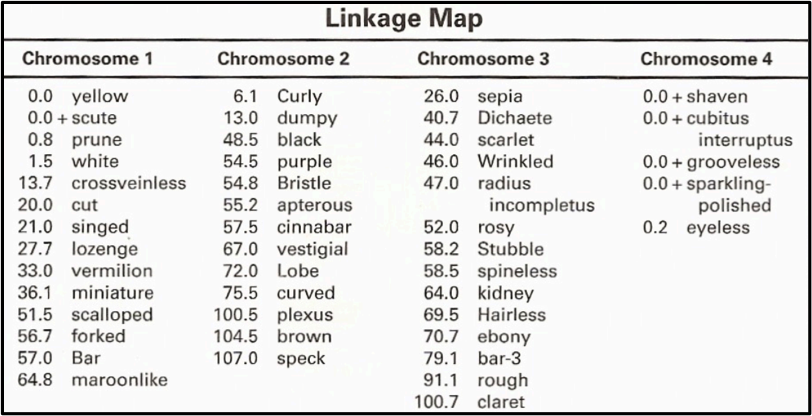
There are many mutant variations of Drosophila with mutations in eye pigment, body pigment, body bristles and wing shape or size. The mutant we worked with is Ebony which is one of three body color mutations. The yellow mutation is sex-linked gene which is located on a sex chromosome. Ebony and brown mutations are both autosomal recessive mutations and typically present with a 3:1 ration in favor of the wild type allele. Drosophila melanogaster have 4 chromosomes, all of which have been mapped out showing us that the ebony mutation is located on chromosome 3. The chart below shows the complete linkage and mapping for Drosophila melanogaster.
Materials and Methods:
Each group was given a stock of wild type drosophila and a mutant type to work with. Our group was given the mutant type Ebony which has a black body. First thing we did was set up additional stocks of both types of drosophila. This is done by taking plastic vials 1.25” by 4” and placing about 25mL of culture medium Formula 4-24 Blue, supplied by Carolina Biological Supply, into the tube. Equal volume of water was then added to the dry mix. Once all the water is absorbed, a piece of netting was placed into the vial, pressing it into medium, and then about 6 to 10 grains of yeast are added. With the vials ready, we moved about 20 of each type of fly into a new vial and marked them with type, gender, and date.
Once a number of vials were set up and breeding well, we began to separate out virgin females from both the wild type and the ebony Drosophila. The first step was to take a vial of each type and remove all living flies leaving only eggs, pupae and larvae. To obtain females the vials need to be monitored closely and as soon as a new fly emerges it has to be isolated and sexed. Once the fly is isolated we anesthetized it using FlyNap which was supplied by Carolina Biological Supply. Using a sterile swab, we wiped the inner rim of the FlyNap jar rather than dipping the swab into the liquid to insure we didn’t kill the fly. We then took the swab and pressed the non-cotton end into the cotton stopper and closed the vial with the swab inside. After about 20 seconds we removed the stopper and replaced it will a clean one. This way there are enough fumes in the vial to knock out the fly but there is less risk of killing it. Once the fly is asleep, we observed it under a dissecting scope or magnifying glass to determine gender. Females were placed into a newly prepared vial with medium, making sure not to mix wild type and ebony, and males into another. Once we have about 6 virgin wild type females in the vial, we isolated 6 ebony males and placed them in to the vial. The same was done for ebony females with wild type males. This is the P generation.
After 7 to 10 days, once larvae are present, the parents from the vials are removed. All flies that emerge after the parents are removed are F1 generation and are placed into a new vial with fresh medium.
Again, after 7 to 10 days once larvae appear the parents are removed. All flies that emerge once the F1 parents have been removed are now F2 generation.
Once the F2 generation starts to emerge they are counted. To do so we first anesthetize them. Once sleep, we separated them under a dissecting scope or magnifying glass by gender. The males and females were both then closely examined for wild type or ebony phenotype. The number of wild type and ebony phenotype present within gender groups was then recorded.
With this data, a chi-square analysis was conducted.
Results:
|
Chi Square Analysis X1 |
|||||
| Observed (o) | Expected (e) | Deviation (o-e) | Deviation^2 | D2/e | |
|
Wild Type |
134 |
138.75 |
-4.75 |
22.5625 |
0.163 |
|
Ebony |
51 |
46.25 |
4.75 |
22.5625 |
0.489 |
|
Chi square= |
0.650 | ||||
|
P= |
0.42 | ||||
|
Chi Square Analysis X2 |
|||||
| Observed (o) | Expected (e) | Deviation | |||
(o-e)Deviation2D2/e
Wild Type
27
27.75
-0.75
0.5625
0.020
Ebony
10
9.25
0.75
0.5625
0.061
Chi square=
0.081
P=
0.78
Chi Square Analysis X3
Observed (o)Expected (e)Deviation (o-e)Deviation^2D2/e
Wild Type
71
66.75
4.25
18.063
0.271
Ebony
18
22.25
-4.25
18.063
0.812
Chi square=
1.082
P=
0.298
Chi Square Analysis X4
Observed (o)Expected (e)Deviation (o-e)Deviation^2D2/e
Wild Type
77
73.5
3.5
12.25
0.167
Ebony
21
24.5
-3.5
12.25
0.500
Chi square=
0.667
P=
0.414
Chi Square Analysis X5
Observed (o)Expected (e)Deviation (o-e)Deviation^2D2/e
Wild Type
364
333
32
1024
3.075
Ebony
80
111
-32
1024
9.225
Chi square=
12.300
P=
0.0007
Chi Square Analysis X6
Observed (o)Expected (e)Deviation (o-e)Deviation^2D2/e
Wild Type
364
349.5
14.5
210.25
0.602
Ebony
102
116.5
-14.5
210.25
1.805
Chi square=
2.406
P=
0.121
|
Ebony Males X Wild Type Females Chi Square Analysis Cross 1, 4 and 5 |
|||||
| Observed | Expected | Deviation | |||
(o-e)Deviation2D2/EWild Type 3567537309001.6760Ebony 1149179-309005.0279Total716716———————————-X2 = 6.7039 P = 0.0096
|
Wild Type Males X Ebony Females Chi Square Analysis Cross 2, 3 and 6 |
|||||
| Observed | Expected | Deviation | |||
(o-e)Deviation2D2/EWild Type 3468450.7517.75297.56250.6602Ebony 1133150.25-17.75297.56251.9804Total601601———————————-X2 = 2.6406 P=0.1042
|
Chi Square Analysis All Crosses |
|||||
| Observed | Expected | Deviation | |||
(o-e)Deviation2D2/EWild Type 3964934.529.5870.250.931Ebony 1282311.5-29.5870.252.794Total ———————————-X2 = 3.725 P = 0.0536
|
Chi Square Analysis All Crosses EXCEPT X5 |
|||||
| Observed | Expected | Deviation | |||
(o-e)Deviation2D2/EWild Type 3602603-110.002Ebony 1202201110.005Total ———————————-X2 =0.007 P = 0.9351
|
Degrees of Freedom (df) |
|
||||||||||
| 0.95 | 0.90 | 0.80 | 0.70 | 0.50 | 0.30 | 0.20 | 0.10 | 0.05 | 0.01 | 0.001 | |
|
1 |
0.004 | 0.02 | 0.06 | 0.15 | 0.46 | 1.07 | 1.64 | 2.71 | 3.84 | 6.64 | 10.83 |
|
2 |
0.10 | 0.21 | 0.45 | 0.71 | 1.39 | 2.41 | 3.22 | 4.60 | 5.99 | 9.21 | 13.82 |
|
3 |
0.35 | 0.58 | 1.01 | 1.42 | 2.37 | 3.66 | 4.64 | 6.25 | 7.82 | 11.34 | 16.27 |
|
Nonsignificant |
Significant |
||||||||||
Discussion:
Data was collected over a 3 month period and we collected 6 sets of data. The first two crosses that we set up were Cross 1, Ebony Males X Wild Type Females, and Cross 2, Wild Type Males X Ebony Females. Both of these were kept in the incubator in the fly lab at 27oC at all times. The second 2 crosses were Cross 3, Wild Type Males X Ebony Females and Cross 4, Ebony Males X Wild Type Females. These two crosses were raised in my bedroom which had a temperature fluctuation from 60oF to 70oF. The last two crosses were Cross 5, Ebony Males X Wild Type Females, and Cross 6, Wild Type Males X Ebony Females. Cross 5 and 6 were done by Tinna and stored in her home at 50oF to 60oF.
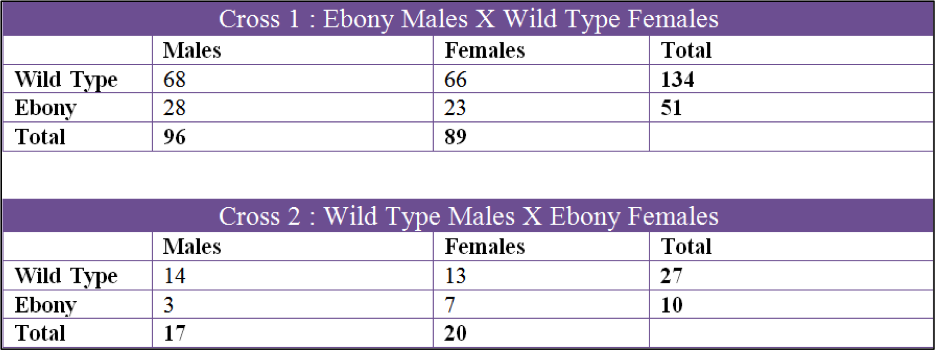
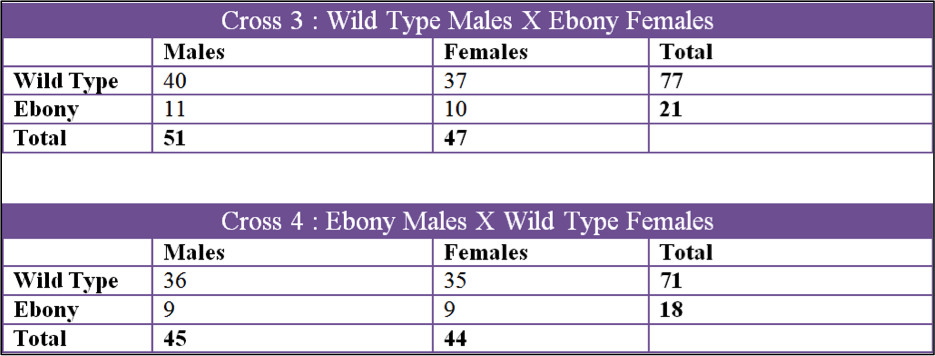
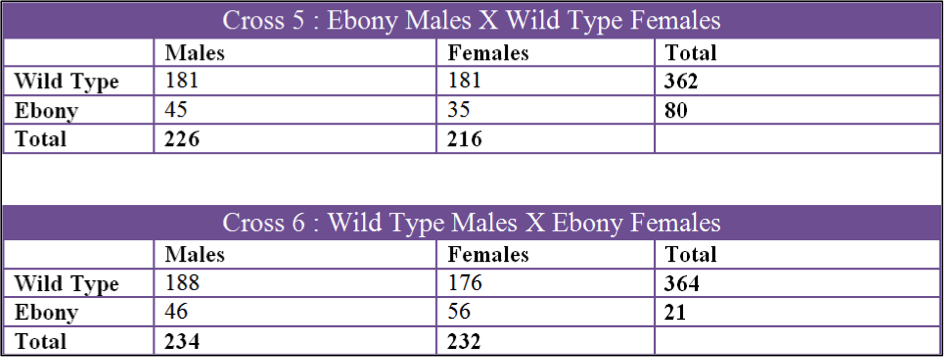
Using the data we acquired, we were able to rule out the ebony mutation being a sex linked gene. The first set of figures in the results section shows all the crosses by gender and mutation. All six crosses showed that the male to female ratio in both wild type and ebony were roughly 1:1 which means that there is no correlation between the ebony body color and sex.
The first cross, X1, had a chi square value of 0.650 which gives us a P value of 0.42. Looking at the probability chart above, the value is lower than 3.84 and we can accept this data. X2 had a chi square value of 0.081 and a P value of 0.78 which can also be accepted. X3 had a chi square value of 1.082 and a P value of 0.298 and the data can be accepted by these values. X4 had a chi square of 0.667 and P value of 0.414 so the data can be accepted. X5 had a chi square value of 12.300 and a P of 0.0007 which is over 3.84 and we fail to accept. X6 had a chi square of 2.406 and a P of 0.121 which can be accepted.
We had two types of crosses, the Wild Type Male X Ebony Female and the Ebony Male X Wild Type Female, so I compared the 2 crosses against each other. We already established that there is no correlation between sex and mutation so the data should have shown minimal differences between the two crosses. However, after a chi square analysis of crosses 1, 4 and 5 (ebony males X w/t females) and cross 2, 3 and 6 (w/t males x ebony females), only one set of data was accepted. The ebony males X w/t female data is rejected with a chi square 6.0739, which is over the 3.84 value provided by the probability chart, and the w/t females X ebony males is accepted with a chi square of 2.641. The fact that one set of data is rejected and the other accepted could be explained by cross 5 which was rejected due to high chi square value.
Combining all data and conducting a chi square analysis, the chi square value is 3.725 which is under 3.86 and can be accepted. Once all the data is combined, even with the rejected cross 5, the data can overall be accepted. This means that our data proves that the ebony mutation is an autosomal chromosome gene that displays typical Mendelian inheritance with a 3:1 ration in favor of the wild type Drosophila.
Cross 5 was the only cross that could not be accepted. The ebony count was exceptionally low in comparison to the wild type. The total number of F2 flies in this cross was 444 and wild type should have accounted for 75% and 25% should have been Ebony. Wild Type accounted for 82% of the flies in this cross and only 18% were ebony which is not a 3:1 ration. One of the things we noticed when counting flies from this cross was how small the ebonys were and how some of them were very slow moving. This cross was kept at a relatively low temperature which caused them to mature a lot slower. It took nearly two weeks for adult flies in the F1 to emerge in the colder environment. One explanation for the low number of Ebony Drosophila in this cross could be that the mutant flies could not handle the cold as well as the wild type and there for a fair amount died at the larval stage or didn’t hatch at all. The second explanation as to why the numbers for this cross were skewed could be because of the F3 generation contaminating the vial. The F2 parents were placed in the vial on March 3rd but the first F2 offspring were not removed until April 3rd. A full month passed before the F2 were removed and it is possible that some mated and laid eggs before they were removed giving rise to F3 offspring. Cross 6 was kept in the same environment and even though it was accepted, the chi square was still higher than more of the other crosses. Similarly, the vials kept in the incubator, cross 1 and cross 2, had the best chi square values.
If I take all ACCEPTED data, crosses 1,2,3,4 and 6, the chi square value is 0.007 and the P value is 0.9351. The accepted data can be combined because we ruled out sex linkage so the mutation of the male or the female is irrelevant. This data tells us that if the experiment were repeated, there is a 94% chance that we would see the same results.
References:
Morgan, T. H. “Sex Limited Inheritance In Drosophila.” Science 32.812 (1910): 120-22. Print.
O’Neil, Dennis. “Basic Principles of Genetics: Mendel’s Genetics.” Basic Principles of Genetics: Mendel’s Genetics. Palomar College, 1997. Web. 07 May 2013. <http://anthro.palomar.edu/mendel/mendel_1.htm>.
Powell, Jeffrey R. Progress and Prospects in Evolutionary Biology: The Drosophila Model. New York: Oxford UP, 1997. Print.
Klug, William S., and Sarah M. Ward. Essentials of Genetics. Boston: Pearson, 2013. Print
Miko, Ilona, PH.D. “Thomas Hunt Morgan and Sex Linkage.” Skitable. Nature Education, 2008. Web. 06 May 2013. <http://www.nature.com/scitable/topicpage/thomas-hunt-morgan-and-sex-linkage-452#>.
Geiger, Peter. “An Introduction to Drosophila Melanogaster.” An Introduction to Drosophila Melanogaster. Arizona Universtiy, 2002. Web. 07 May 2013. <http://biology.arizona.edu/sciconn/lessons2/geiger/intro.htm>.
“Carolina Drosophila Manual.” Carolina Biological Supply, n.d. Web. 27 Jan. 2013.

