The Creation of Isopentyl Acetate
The Creation of Isopentyl Acetate
By: Stephanie Tress
INTRODUCTION8
Some of the food and drinks that are consumed today obtain their flavor and odor from esters, which are found throughout nature[2]. Some things contain not one ester but a combination of esters in order to obtain the right flavor[2].
Esters won’t be used for things like perfume because they aren’t stable and will react with perspiration which will then give off an unpleasant odor[2].
Although a fruity and sweet odor is liked by many, the solvent is similar to the honey bee’s alarm pheromone[2]. When this pheromone is activated, it causes a response from others of the same species[2].
Infrared Spectroscopy is used to identify organic structures through the infrared absorptions from the bonds in the molecule[1]. The IR spectrum ranges from 4000 cm-1 to 600 cm-1[1]. The molecule can be identified through the various peaks on the spectra[1].
The objective of this lab was to create isopentyl acetate by esterification of acetic acid with isopentyl alcohol.
PROCEDURE
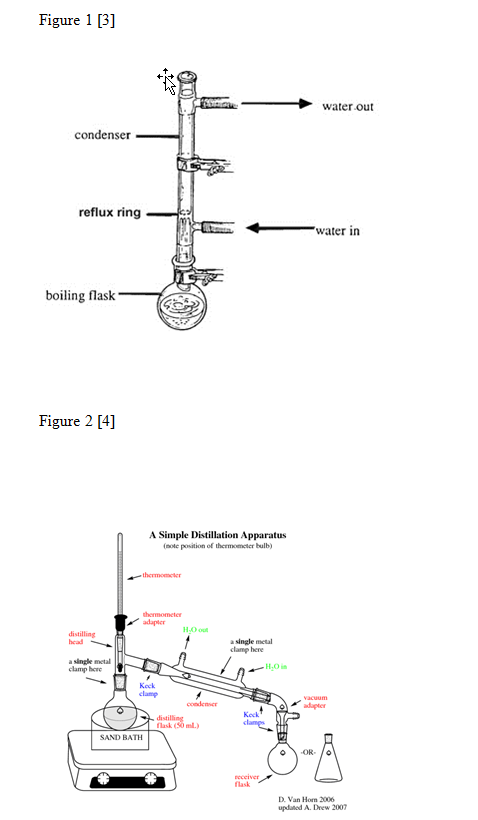
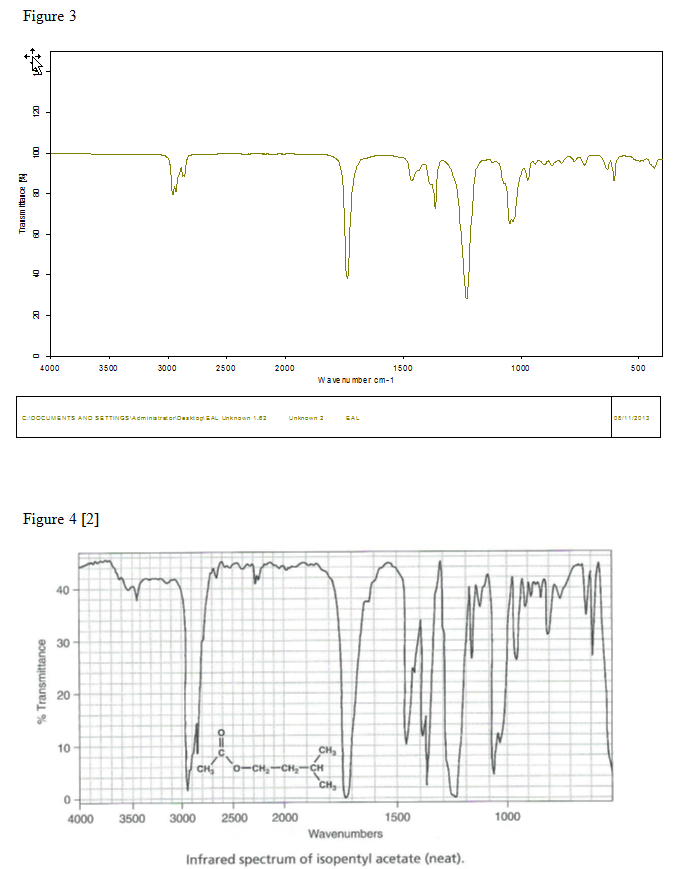
A mixture of 5.0mL (4.111g) of isopentyl alcohol, 7.0mL of glacial acetic acid, and 1mL of concentrated sulfuric acid was created in a 25mL round-bottomed flask. The round-bottomed flask was hooked to the reflux apparatus that was assembled as shown in Figure 1 and the mixture was brought to a boil for 60 to 75 minutes. The mixture was cooled to room temperature and put in a separatory funnel with 10mL of water. The funnel was shaken vigorously and vented several times. The bottom layer was drained from the separatory funnel into a beaker. 5mL of 5% sodium bicarbonate was then put into the separatory funnel. The separatory funnel was shaken and vented several times. The bottom layer was drained into the same beaker. 5mL of saturated sodium chloride was added to the contents of the separatory funnel. The separatory funnel was shaken and vented several times. The bottom layer was drained into a different beaker. The mixture that was left in the separatory funnel was transferred to an Erlenmeyer flask with 1g of anhydrous sodium sulfate. The flask was corked and was left to sit for 10 to 15 minutes. The mixture was transferred to another Erlenmeyer flask and .503g of anhydrous sodium sulfate was added. A distillation apparatus was assembled as shown in Figure 2 with the receiving flask immersed in an ice bath. The mixture was transferred into a round-bottomed flask and attached to the distillation apparatus. The mixture was distilled until there were only approximately two drops left in the distillation flask. The product that was now in the receiving flask was then weighed. The percent yield was determined and an IR was done on the product.
DATA
Isopentyl alcohol: 5.0mL, 4.111g
Glacial acetic acid: 7.0mL
Concentrated sulfuric acid: 1mL
Water: 10mL
5% Sodium bicarbonate: 5mL
Saturated sodium chloride: 5mL
Anhydrous sodium sulfate: 1.0g, .503g
CALCULATIONS
Boiling point: 131⁰C
4.111g isopentyl alcohol × 1mol = 0.0466mol × 130.19g = 6.0717g isopentyl acetate
88.148g 1mol
% yield = 3.887g/6.0717g × 100 = 64.22%
DISCUSSION AND CONCLUSION
The objective of this lab was to create isopentyl acetate by esterification of acetic acid with isopentyl alcohol through a process of reflux and distillation. In the end, there was a 64.22% yield found from the mixture. This could be due to inaccurate draining of the bottom layers from the separatory funnel and not boiling enough of the mixture during distillation. The final product was run through IR and a spectrum was obtained as shown in Figure 3. When Figure 3 and Figure 4 were compared, most f the peaks are in the same place although in Figure 3 the peaks aren’t as prominent as they are in figure 4. The first peak, which is at approximately 3000 cm-1, says that there is a C-H alkyl. The second main peak, which is at approximately 1750 cm-1, in Figure 3 says that there is a C=O. The third prominent peak, at approximately 1250 cm-1, in Figure 3 says that there is a C-O stretch phenol.


References
[1]Infrared Spectroscopy. (n.d.). University of Missouri, St. Louis. Retrieved from http://www.umsl.edu/~orglab/documents/IR/IR2.html
[2]Pavia, D. L., Lampman, G. M., Kriz, G. S., & Engel, R. G. (2005). Introduction to Organic Laboratory Techniques. Thomson Brooks/Cole.
[3]Refluxing. (n.d.). The Organic Chemistry Laboratory Web Pages – UW Madison. Retrieved from http://www.chem.wisc.edu/areas/organic/orglab/tech/reflux.htm
[4]Simple distillation apparatus graphicasd cdx. (n.d.). Docstoc.com. Retrieved from http://www.docstoc.com/docs/40931375/simple-distillation-apparatus-graphicasd-cdx
