Determination of Water Hardness
Determination of Water Hardness
By: Diane Krehbiel
Abstract:
In this experiment, the hardness of an unknown water sample will be determined. The calcium in the water will be measured by performing a titration with EDTA. Eriochrome Black T will be used as an indicator. Standardization of EDTA will be performed first and then the determination of calcium concentration. After standardizing the EDTA, the average molarity was found to be 0.01114 M. The calcium concentration was found to be 203.8 ppm ± 5.66.
Introduction:
Complexometric titrations are titrations that can be used to discover the hardness of water or to discover metal ions in a solution. Ethylenediaminetetraacetic acid, also known as EDTA, is commonly used in complexometric titrations. This is because it makes six bonds with metal ions to form one to one complex (“Complex Titrations”). In a complexometric titration, an ion is transformed into a complex ion. The equivalence point is determined by a metal indicator. Erichrome black T is an indicator that can be used to determine calcium content in a solution. The complex that is initially formed is red. After all the calcium ions have reacted, the complex then turns blue. This indicates the endpoint of the titration (“Camp and Seely”).
In the experiment, EDTA will first be made and then standardized. This will be done by preparing a calcium chloride solution. In the reaction with the EDTA, calcium carbonate is converted to calcium chloride. Ammonia-ammonium chloride will also be prepared to be used as a buffer in the solution. The professor prepared the Erichrome black T to be used as an indicator. This indicator will be cause the solution to be red at the before the titration and then at the endpoint, the solution will turn blue. Make sure it is blue and not purple. After the standardization of EDTA, the calcium content in an unknown water sample will be found. This will be done with same way as the first titration occurred. The hardness will then be calculated in parts per million.
Experimental:
To begin this experiment, prepare 0.01 M sodium-EDTA. Weight out about 4.0 grams of disodium dihydrogen EDTA dehydrate into a 400 mL beaker. Dissolve the solids in water and transfer this solution into a clean 1 liter volumetric flask. Dilute with water to the line. If the solution is turbid, add a few drops of 0.1 M sodium hydroxide. Mix solution thoroughly. Next prepare a standard calcium chloride solution. To do this, weigh accurately about 0.4 g of primary standard calcium carbonate that has already been dried at 100°C. Transfer the solid to a 500 mL volumetric flask and dissolve with about 100 mL of water. Add 50% hydrochloric acid until there is no effervescence and the solution is clear. Dilute with water to the mark and mix the solution thoroughly. This reaction converts calcium carbonate to calcium chloride as shown below:
![]()
Prepare an ammonia-ammonium chloride buffer by dissolving about 6.75 g of ammonium chloride in 57 mL of concentrated ammonia. Transfer to a 100 mL volumetric flask and dilute to the mark. Make sure to handle concentrated ammonia in the hood. The Erichrome Black T was prepared by the professor by dissolving 0.50 g of reagent grade Erichrome Black T indicator in 100 mL of alcohol. Solutions older than 2 months should not be used.
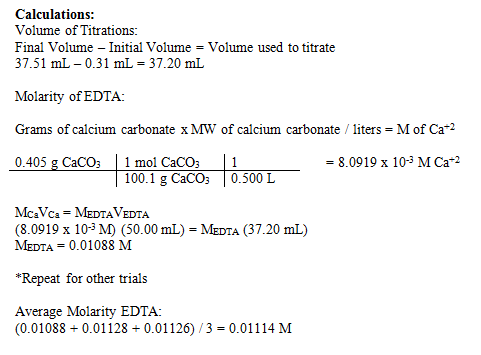
Now, standardize the EDTA solution. Pipet 50 mL portions of the calcium chloride solution into three 250 mL Erlenmeyer flasks. Add 5 mL portions to each flask of the ammonia-ammonium buffer and 5 drops of Erichrome Black T indicator. 5 drops of the indicator may not be enough indicator and a few more drops may be necessary to add to the solution. Titrate this solution with EDTA to the point where the color changes from wine-red to pure blue. Do not stop titrating at a violet or purple color. Make sure the Erichrome Black T indicator is prepared fresh. Repeat this titration with all three trials and record the volume. Calculate the average molarity of the EDTA solution from the concentration of the calcium chloride solution and the volume of EDTA used to titrate.
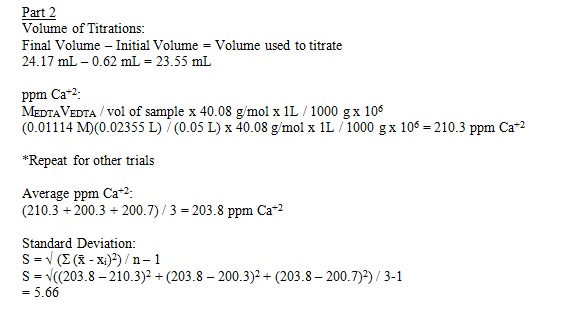
Determine the unknown calcium concentration in a sample of water. Pipet 50 mL portions of unknown water into three 250 mL Erlenmeyer flasks. Add 5 mL of ammonia-ammonium buffer and Erichrome Black T indicator. Titrate with EDTA until a blue color appears. Use the volume and molarity of EDTA to calculate the water hardness in ppm Ca+2.
Data:
Part 1
Sodium-EDTA used:
4.204 g
Calcium carbonate used:
0.4050 g
Initial Volume of Titrations:
1) 0.31 mL
2) 0.55
3) 0.36
Final Volume of Titrations:
1) 37.51 mL
2) 36.41
3) 36.30
Difference of Volumes for Titrations:
1) 37.20 mL
2) 35.86
3) 35.94
Molarity of EDTA calculated:
1) 0.01088 M
2) 0.01128
3) 0.01126
Average Molarity:
0.01114 M
Part 2
Initial Volume of Titrations:
1) 0.62 mL
2) 0.08
3) 1.89
Final Volume of Titrations:
1) 24.17 mL
2) 22.51
3) 24.36
Difference of Volumes for Titrations:
1) 23.55 mL
2) 22.43
3) 22.47
ppm Ca+2 calculated:
1) 210.3 ppm
2) 200.3
3) 200.7
Average ppm Ca+2:
203.8 ppm
Standard Deviation:
5.66
Results:
Molarity of EDTA calculated:
1) 0.01088 M
2) 0.01128
3) 0.01126
Average Molarity:
0.01114 M
ppm Ca+2 calculated:
1) 210.3 ppm
2) 200.3
3) 200.7
Average ppm Ca+2:
203.8 ppm ± 5.66
Discussion:
The results from this experiment were very reasonable. In the first part of the experiment I found the average molarity to be 0.01114 M. We were supposed to make a solution with a molarity of 0.01 M so the EDTA had an accurate molarity. In the second part of the experiment we found the hardness of a water sample. This was done through finding the calcium content in the water. All three trials of this yielded similar results indicating they are accurate. The average calcium content found was 203.8 ppm Ca+2. Because two of the trials showed results of 200 ppm and one had the result of 210 ppm, this indicates that the actual hardness of the water was closer to 200 ppm.
The hardness of water is structured by a numerical range. Soft water has a ppm between 0 and 75. Moderately hard has a range of 75-150. Hard is between 150 and 300. Anything over 300 ppm is considered very hard. Our sample was in the hard range of the scale.
If I were to do this experiment again, it would be helpful to put in more indicator at the beginning. One trial I did had not turned blue yet. After adding a couple more drops of indicator, the color changed immediately to blue. The end point had already been passed. In the next trials I added more indicator before starting and ended with much more accurate results. It was difficult in this lab to tell exactly when the endpoint occurred because the color changed to violet before blue. It was hard to distinguish between these colors sometimes. A more abrupt color change would have been better in order to ensure more accurate results.
Conclusion:
In conclusion, the results from this experiment were reasonable. The hardness of a water sample was successfully discovered by finding the calcium content in the sample. The calcium content from the three trials performed were 210.3 ppm, 200.3 ppm, and 200.7 ppm. The average of these three trials with standard deviation was 203.8 ± 5.66 ppm. This showed that the water fell into the range of numbers indicating hard water.
Works Cited
Camp, Ulrich De La, and Oliver Seely. “Complexometric Ca Determination.” N.p., n.d. Web. 15 Oct. 2013.
“Complexometric Titrations.” CHP. N.p., 2000. Web. 15 Oct. 2013.


